Visualise your production data to monitor results as they happen, empowering you to identify and act on deviations immediately. With real-time insights, you can uncover inefficiencies, optimize workflows, and drive continuous improvement across your entire process. Whether on the production floor or remotely, visualisation ensures you stay in control of your operations.
Ask our expert for advice
Johan Ohlsson Sales Manager Lean Production On parental leave
Faster response to production issues ensures minimal downtime.
Identify Inefficiencies
Alerts are prioritized for better resource allocation.
Boost Employee Engagement
Logs actions and causes for continuous improvement.
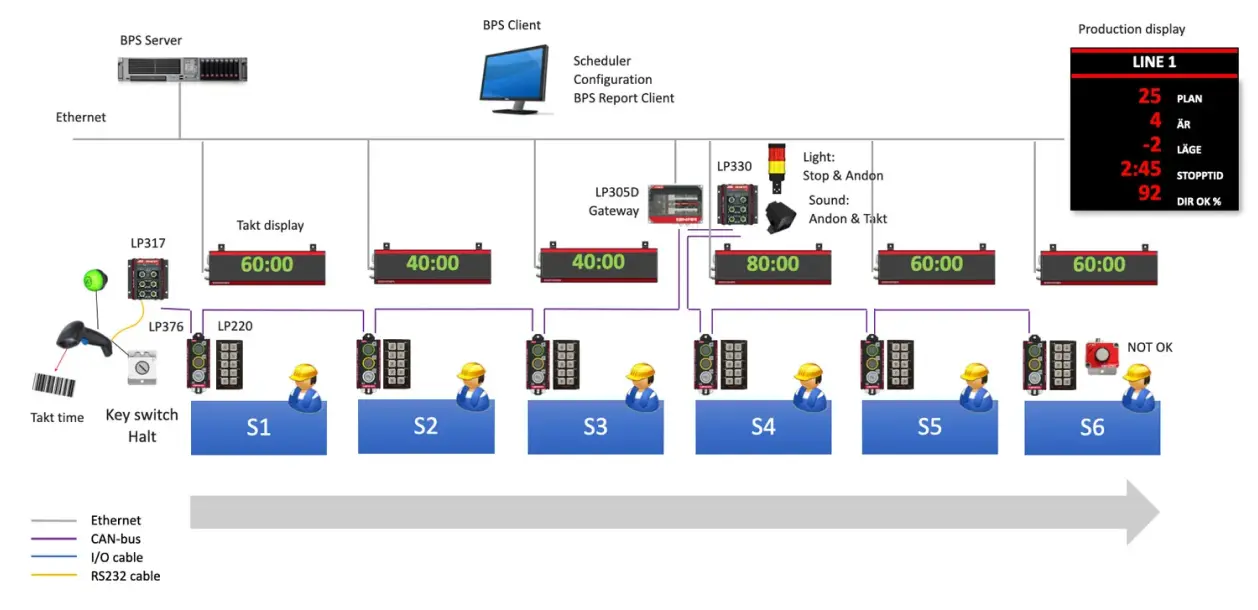
System overview
Enlarge image
Real-Time Insights Wherever You Are
Present accurate data directly in the production environment with LED displays or access it remotely via a web interface. Visualisation ensures you stay informed and can respond to issues from anywhere.
Expose Waste and Bottlenecks
By visualising production flow, waste is revealed, and bottlenecks are identified. Addressing these weak links improves the efficiency of your entire process and supports continuous improvement initiatives.
Boost Engagement and Automation
Display key figures that employees can relate to, such as goals and stop time, to foster motivation and commitment. Digitize daily management to eliminate manual data collection and enable seamless decision-making.
Discover our Product Catalogue
See our wide range of products. We have, among other things, displays, sound, lights and buttons to streamline and quality assure your production.